Dataset Selection
Before creating dashboards, you need to select a dataset to work with. This documentation will guide you through the process of selecting a dataset and provide an overview of the dataset structure.
Dataset Structure
A dataset is a collection of organized data that can be used to create dashboards. The dataset structure can be found here. Datasets are stored in the IndexedDB from the browser.
Filtering
The dataset selection interface is designed to provide a seamless experience for finding and selecting the right dataset for your needs. The UI features a search bar at the top for filtering available datasets.
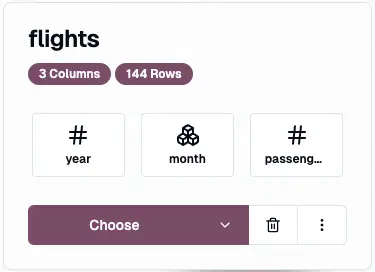
Dataset Card
Each dataset is displayed as a card, providing a concise overview of the dataset's details. The card includes:
-
Title: The name of the dataset, displayed prominently at the top of the card.
-
Description: A brief description of the dataset, providing context and information about the data.
-
Metadata: Information about the dataset, such as the number of columns and rows.
-
Support Level: See here for more information.
-
Columns: A preview of the columns in the dataset, with icons representing the data type.
-
Actions: Three buttons at the bottom of the card allow you to:
- Choose: Select the dataset for creating a dashboard. If you click on the Dropdown, you can also choose, if you want to choose a different template or create a new one. Otherwise the currently selected template is used.
- More: Access additional options and actions for the dataset.
- Delete: Remove the dataset from your local storage.
When a user clicks on a column button, a detailed overview of the column is displayed as a histogram or a bullet list, depending on the column's data type. This provides a quick and intuitive way to understand the distribution of values in the column.
By providing a concise and interactive representation of the dataset, the data card enables users to quickly explore and understand the structure and content of their data, making it easier to identify insights and opportunities for analysis and visualization.